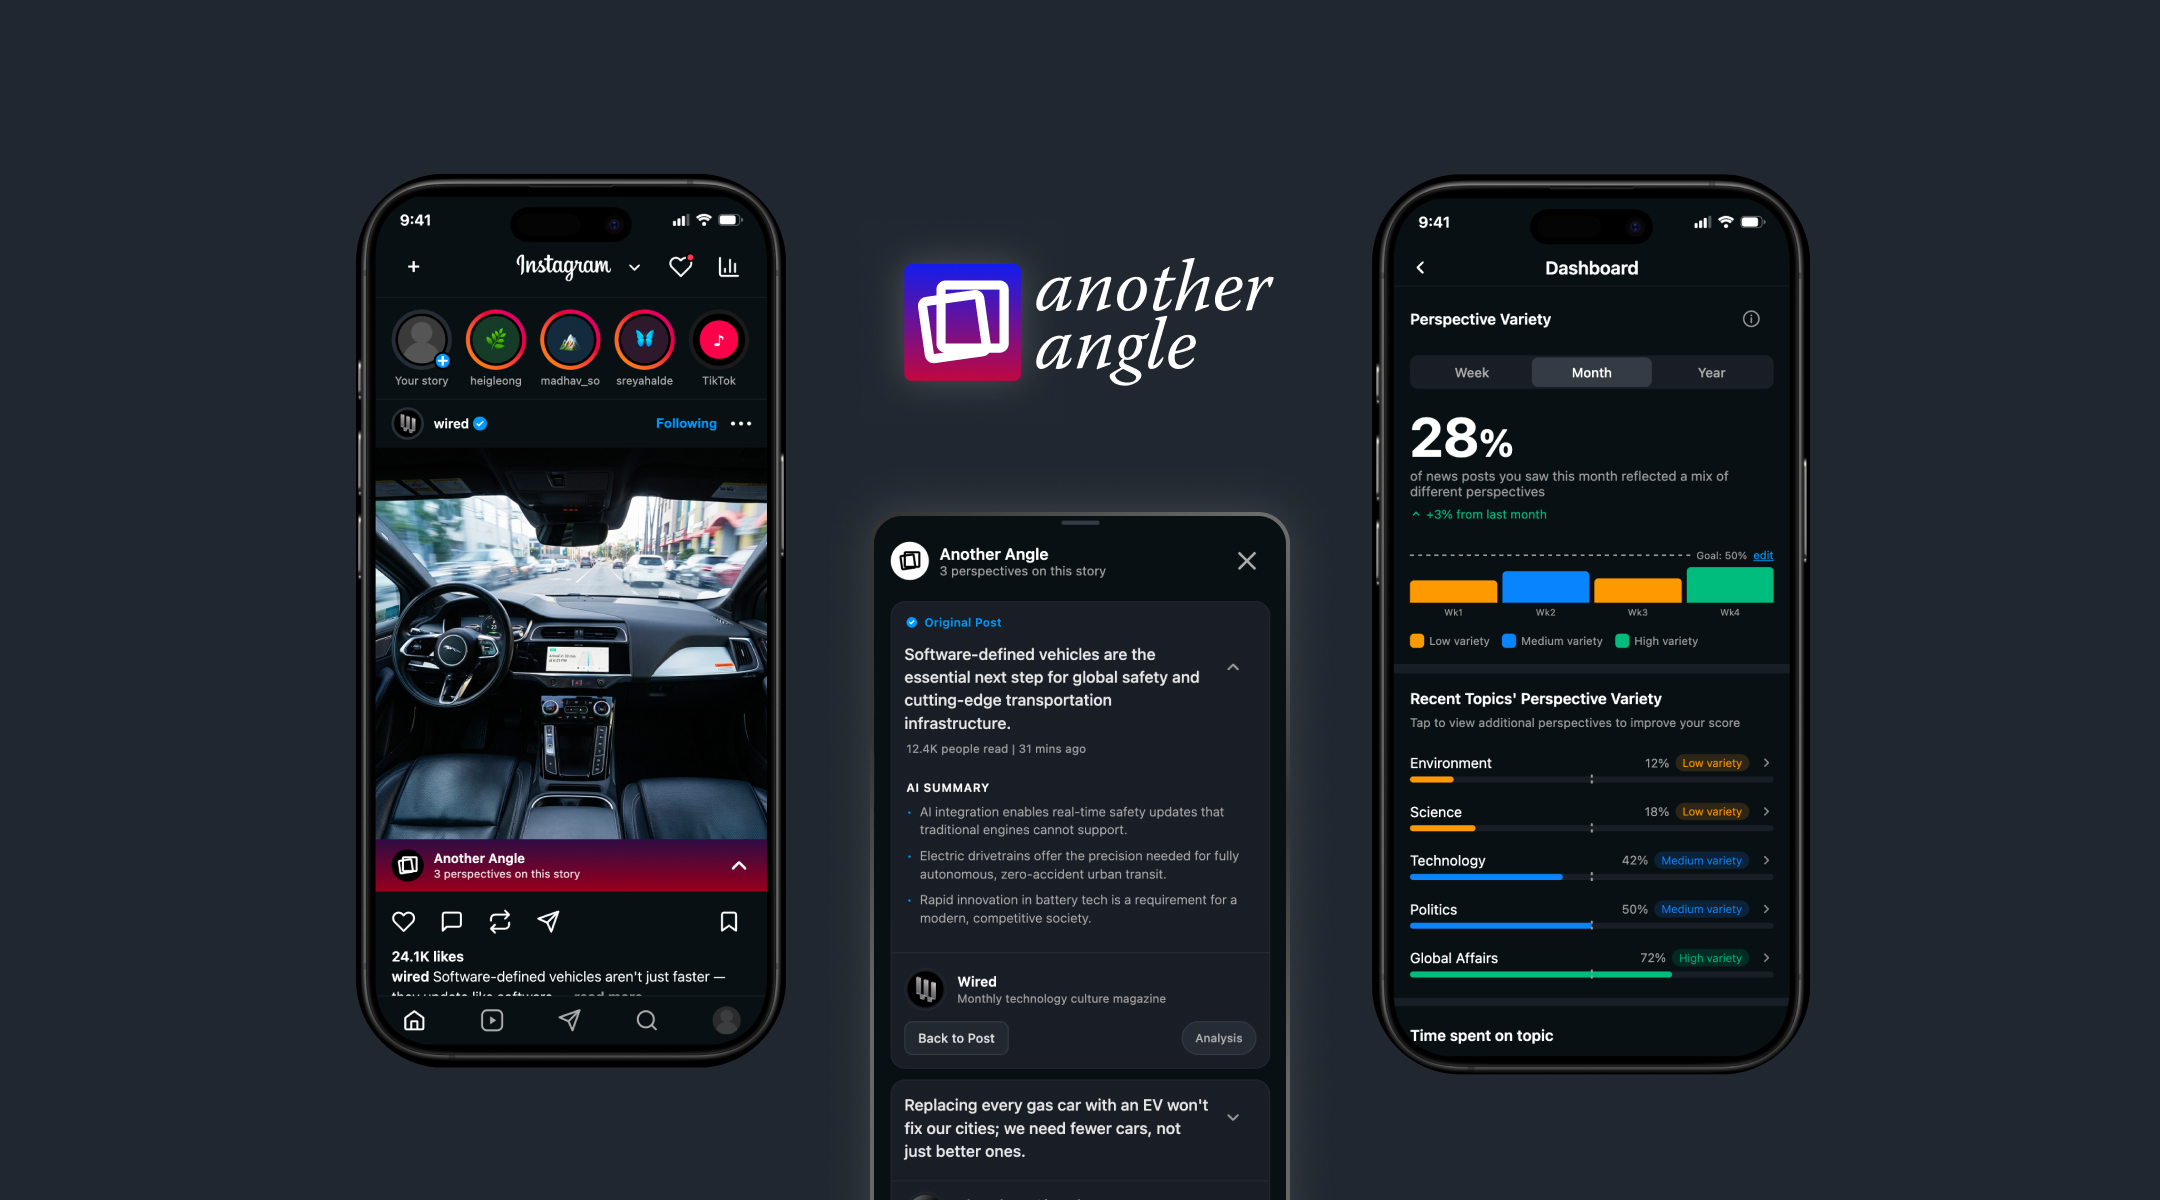
Another Angle — in-feed perspective card on Instagram
Another Angle

Designing an in-feed system for surfacing diverse news perspectives on social media

Another Angle is a speculative cross-platform system that surfaces how the same news story is being covered across different sources and tracks viewpoint diversity over time, directly inside the social media post someone is already looking at. It was my CCA senior thesis, built over two semesters: fall for research and problem framing, spring for three rounds of prototyping and usability testing, ending in a working hi-fi prototype shown at CCA's May 2026 exhibition. Everything on this page, including the research, the testing, and the AI-assisted build, is my own solo work.

Role UX/Product Designer, Solo Designer & Researcher
Duration Fall 2025 – Spring 2026 · CCA senior thesis
Tools Figma, Figma Make, Claude Code, FigJam

Most people are reading a narrower range of viewpoints than they realize

Social platforms rank content by what someone is likely to engage with, and people tend to engage most with content that already matches what they think. Over time, a feed built that way narrows: the same handful of viewpoints, shown back at increasing volume, framed as if they were the whole conversation. Researchers call this a filter bubble.

Most people I talked to, including several in my own survey, had never heard that term. But when I asked them directly to think about their own feed, they described the exact mechanism without needing the vocabulary for it: a sense that they kept seeing the same take on a story, and a vague awareness that if they wanted a different one, they'd have to go find it themselves.

I'd noticed it in my own feed too, scrolling Instagram and catching myself seeing the same framing on a story three or four times in a row. That's where the project started. The design problem that followed was: people know the principle and the fix (go find another source), but the fix lives outside the app they're already in, and that extra step is where the behavior dies.

3
Prototype fidelities
3
Usability rounds
15
Participants tested
Oct 2025

Framing the actual gap before designing anything

Once I had the pattern (people notice sameness in their feed but rarely act on it), I needed to separate two different problems that are easy to collapse into one: people not knowing filter bubbles exist, and people knowing but facing too much friction to do anything about it. My early interviews pointed clearly to the second. That reframing mattered, because it ruled out an entire category of solution (education, awareness campaigns, “here's what bias is” explainers) that other tools in this space already lean on heavily, and pointed instead toward a friction problem: reduce the cost of seeing another angle to close to zero, inside the platform someone is already using.

Nov–Dec 2025

Before sketching anything, I needed to know whether this friction gap had already been solved somewhere, and what design language other tools were using to talk about it.

I ran a comprehensive competitive analysis across the existing approaches to this problem:

  • Bias-rating apps and browser tools, including Ground News, AllSides, NewsGuard, and Nobias
  • Structured-deliberation platforms, including Kialo

I mapped these against three distinct intervention strategies: awareness and transparency, deliberation and collective judgment, and algorithmic or feed-level intervention. I paired that with secondary research in media psychology and behavioral design, and an expert interview with Dr. Patricia Lange, a media anthropologist at CCA.
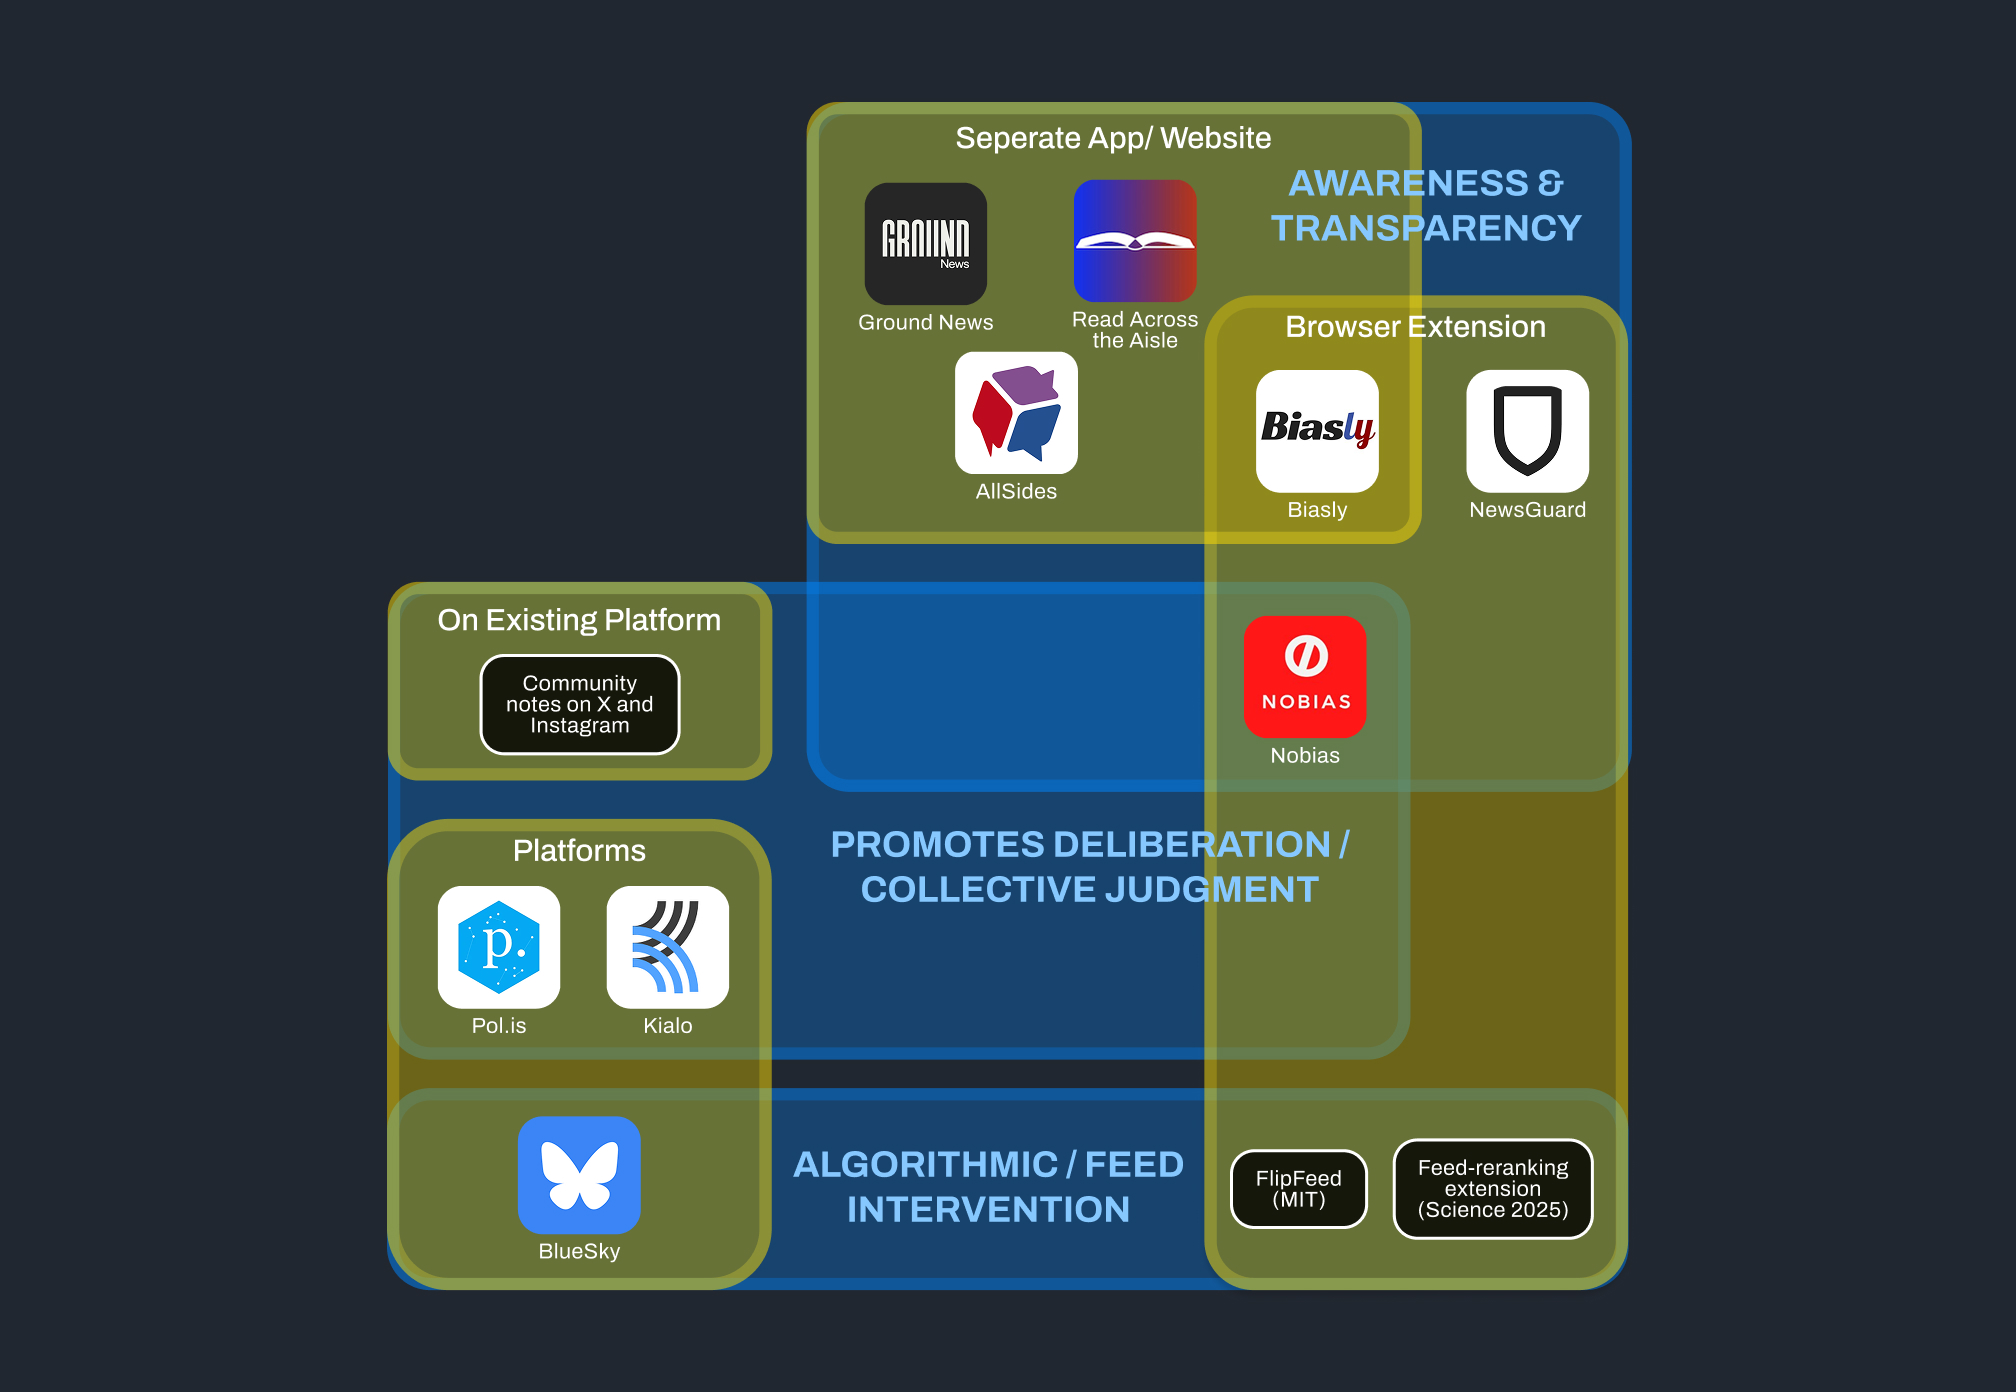
Competitive landscape map — bias-detection, aggregation, and expert-curation tools grouped by product type and intervention strategy

Competitive landscape mapped by product type and intervention strategy

Key findings

  • Every competitor I mapped, regardless of intervention strategy, shared the same structural gap. Each one asked people to adopt a new, separate habit: a standalone app, a browser extension, a second thing to check. None of them lived inside the feed people were already scrolling. That gap is what Another Angle is designed to close.
  • Dr. Lange's interview surfaced a labeling constraint the competitive analysis hadn't: a single labeling scheme likely wouldn't serve every kind of news consumer equally well. Some readers want political shorthand; others are put off by it. A system built for one group risks alienating the other.
  • She also suggested that naming who is saying something (a specific outlet) tends to build more trust than naming what political wing they're associated with.
  • Secondary research gave me the theoretical basis for two decisions I carried through the whole project: keep diverse content embedded in the existing feed rather than building a standalone destination (Wojcieszak & Garrett; Bail et al., 2018), and design the surfacing so it reads as an invitation rather than a correction, since reactance theory (Brehm, 1966) predicts people push back when they feel told their views are wrong.

Every existing tool asks people to leave the platform to fix a problem the platform created. The competitive analysis surfaced a missing location, not a missing feature.
Feb 2026

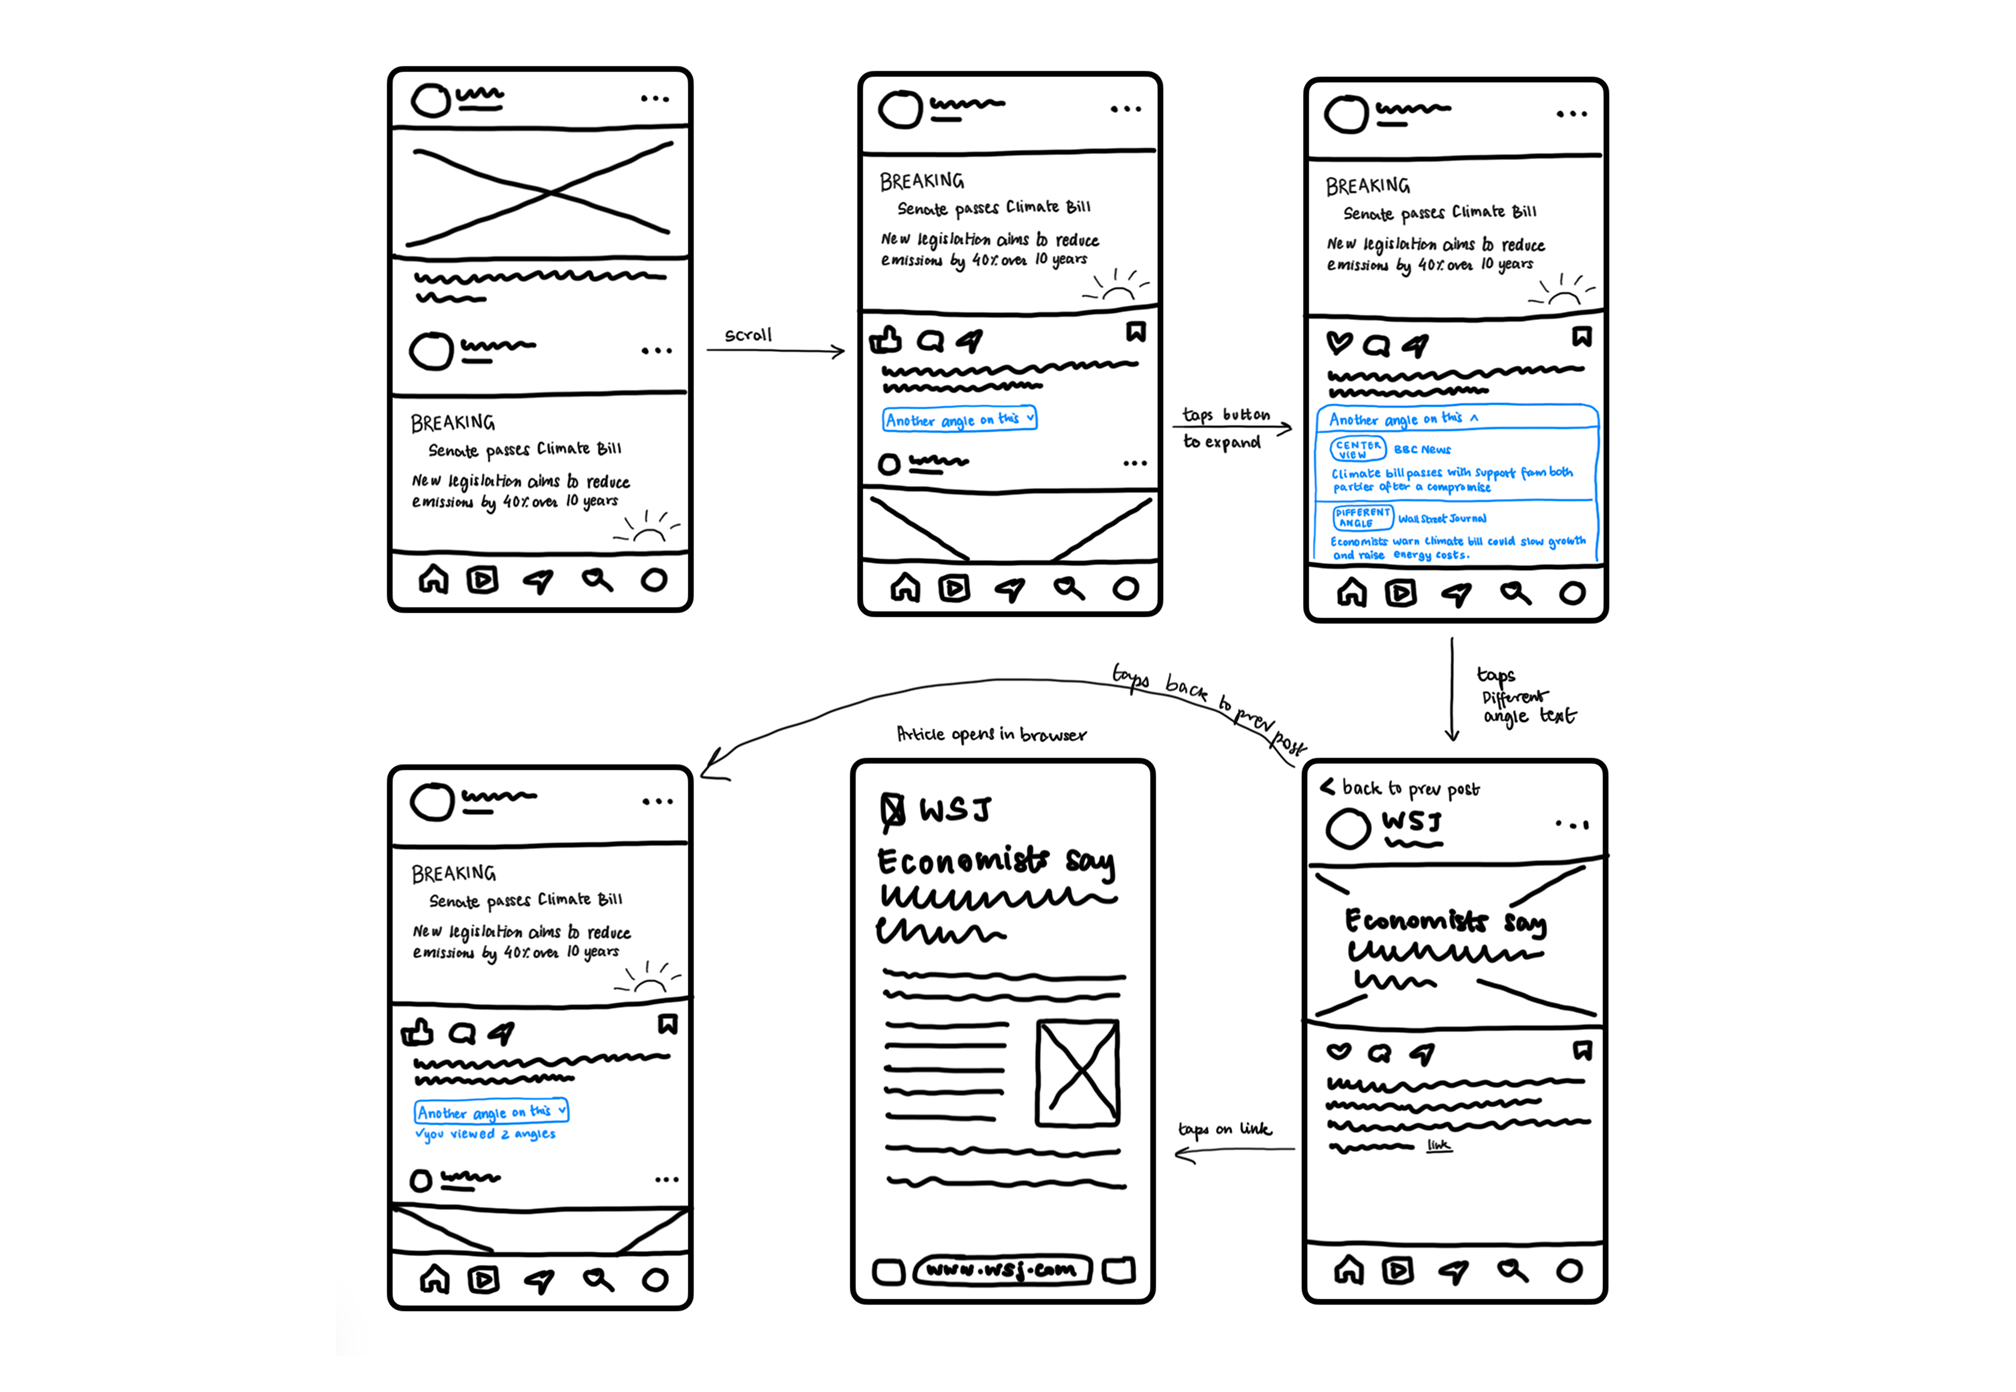
With the research foundation in place, I sketched a hand-drawn prototype of the core mechanism, an in-feed banner offering another angle on the post someone was already looking at, and tested it with 5 participants over a week.

Lo-fi hand-drawn prototype flow: in-feed banner and perspective selection cards

Lo-fi sketch flow: in-feed banner, perspective selection, source cards

Key findings

  • All 5 participants understood the mechanism immediately and, unprompted, described it as lower effort than their current habit of manually searching for other viewpoints. That validated the core premise from the research phase.
  • 4 of 5 participants preferred neutral, value-based framing (“concerned about economic growth”) over political labels like “Left” and “Right,” even though it cost some specificity. Political labels gave some participants useful shorthand, but made others defensive before they'd read the content at all.
  • 3 of 5 participants said they'd have scrolled right past the discovery affordance if they hadn't been told to look for it. It was buried inside a post caption and easy to miss.

Participants consistently engaged with curiosity when the framing was neutral and effort was low, and pulled back when they felt the system was labeling or diagnosing them ideologically.
Design implications for mid-fi

  1. Move the discovery affordance higher in visual hierarchy, onto the post itself rather than the caption.
  2. Test a layered disclosure model: a neutral label by default, with political framing available only on expansion.
Mar 2026

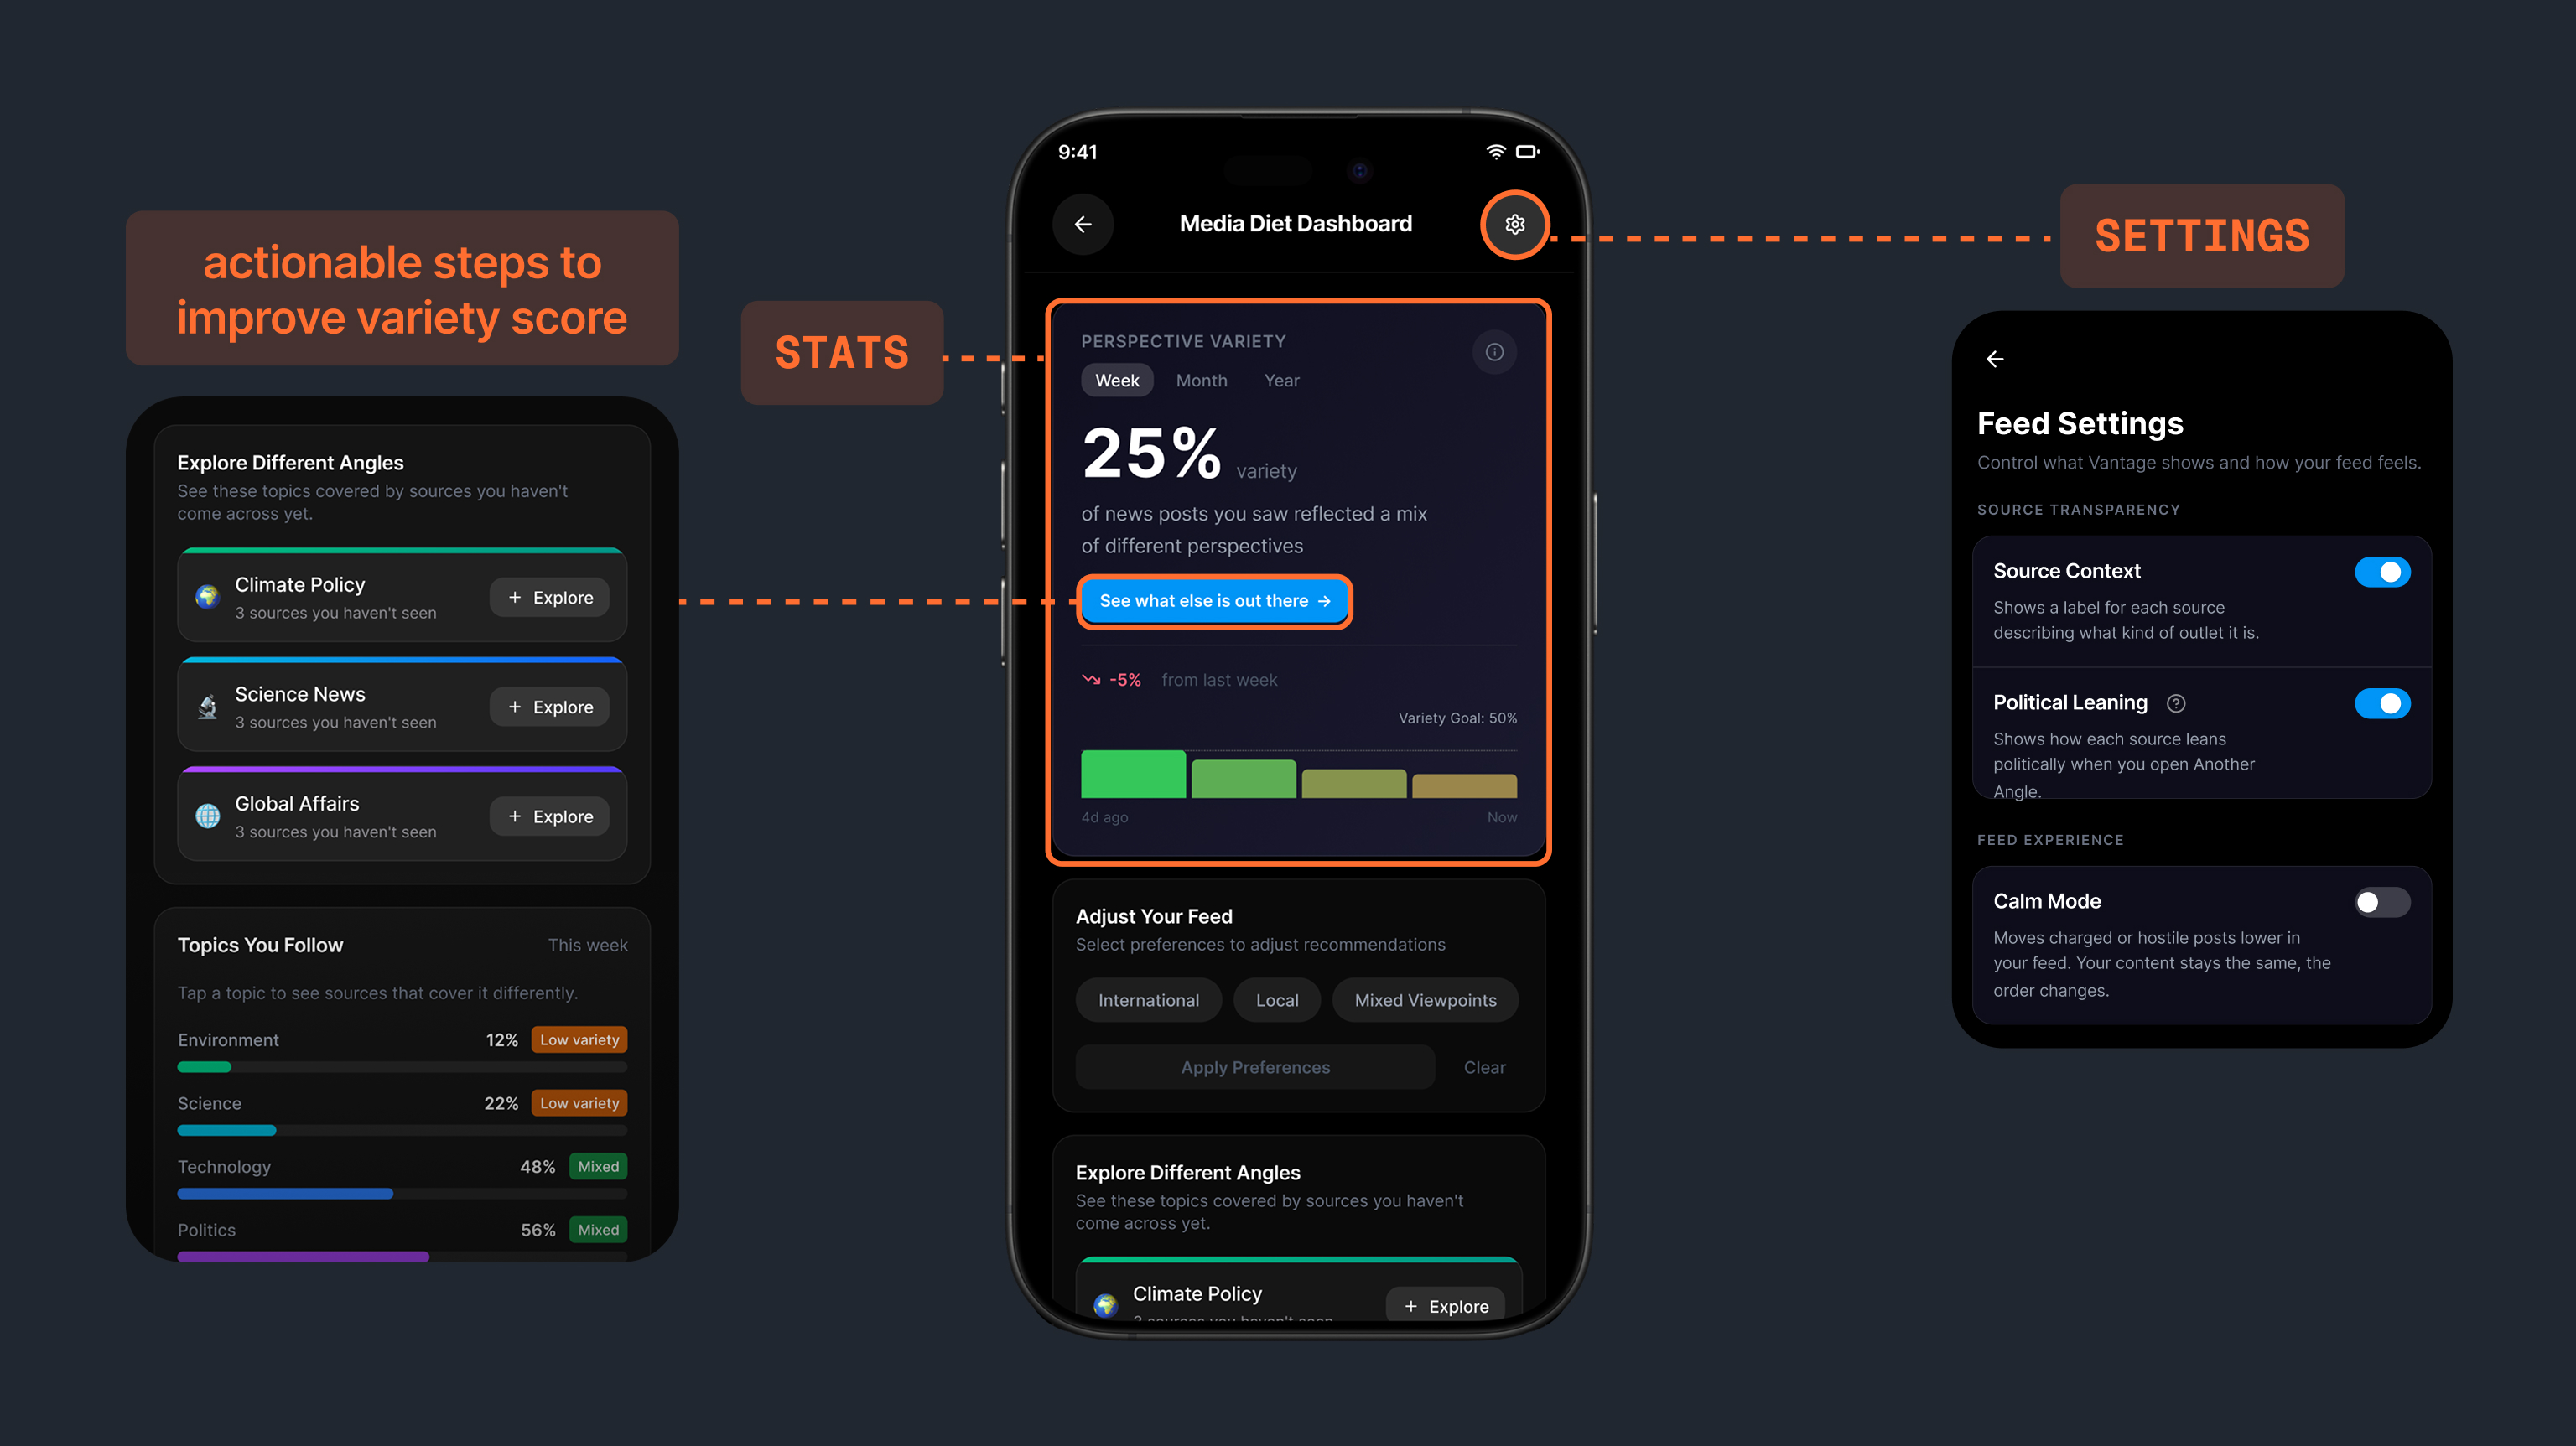
I rebuilt the flow as an interactive, Instagram-native prototype and tested the layered disclosure model, along with a new media diet dashboard surfacing how varied someone's reading had actually been over time.

Mid-fi media diet dashboard with variety score

Mid-fi dashboard — media diet variety score

Key findings

  • Framed around “your bias” or “your viewpoint,” the dashboard read as the system diagnosing participants' politics from their consumption. One participant called it scary and said it limited her to one category, comparing the tracking to being stalked.
  • Framed instead around reading habits and time spent, the same underlying data felt useful rather than judgmental. That distinction, describing habits instead of diagnosing the person, became the operating principle for all dashboard copy going forward.
  • The internal metric shifted from a “similarity score” to a “variety score.” The similarity framing scored backwards from what people expected: a high similarity number read as success, when the actual design goal was the opposite.
  • Participants didn't trust an outlet on name recognition alone, even well-known ones. They wanted recency, engagement signals, and source context before engaging with an unfamiliar perspective. That finding shaped the ranked source-preferences feature and the AI-generated summaries added at the hi-fi stage.

The dashboard should describe reading habits, not diagnose the reader. Design has to emphasize autonomy, the user opting in to diversity, rather than an algorithm deducing their identity for them.
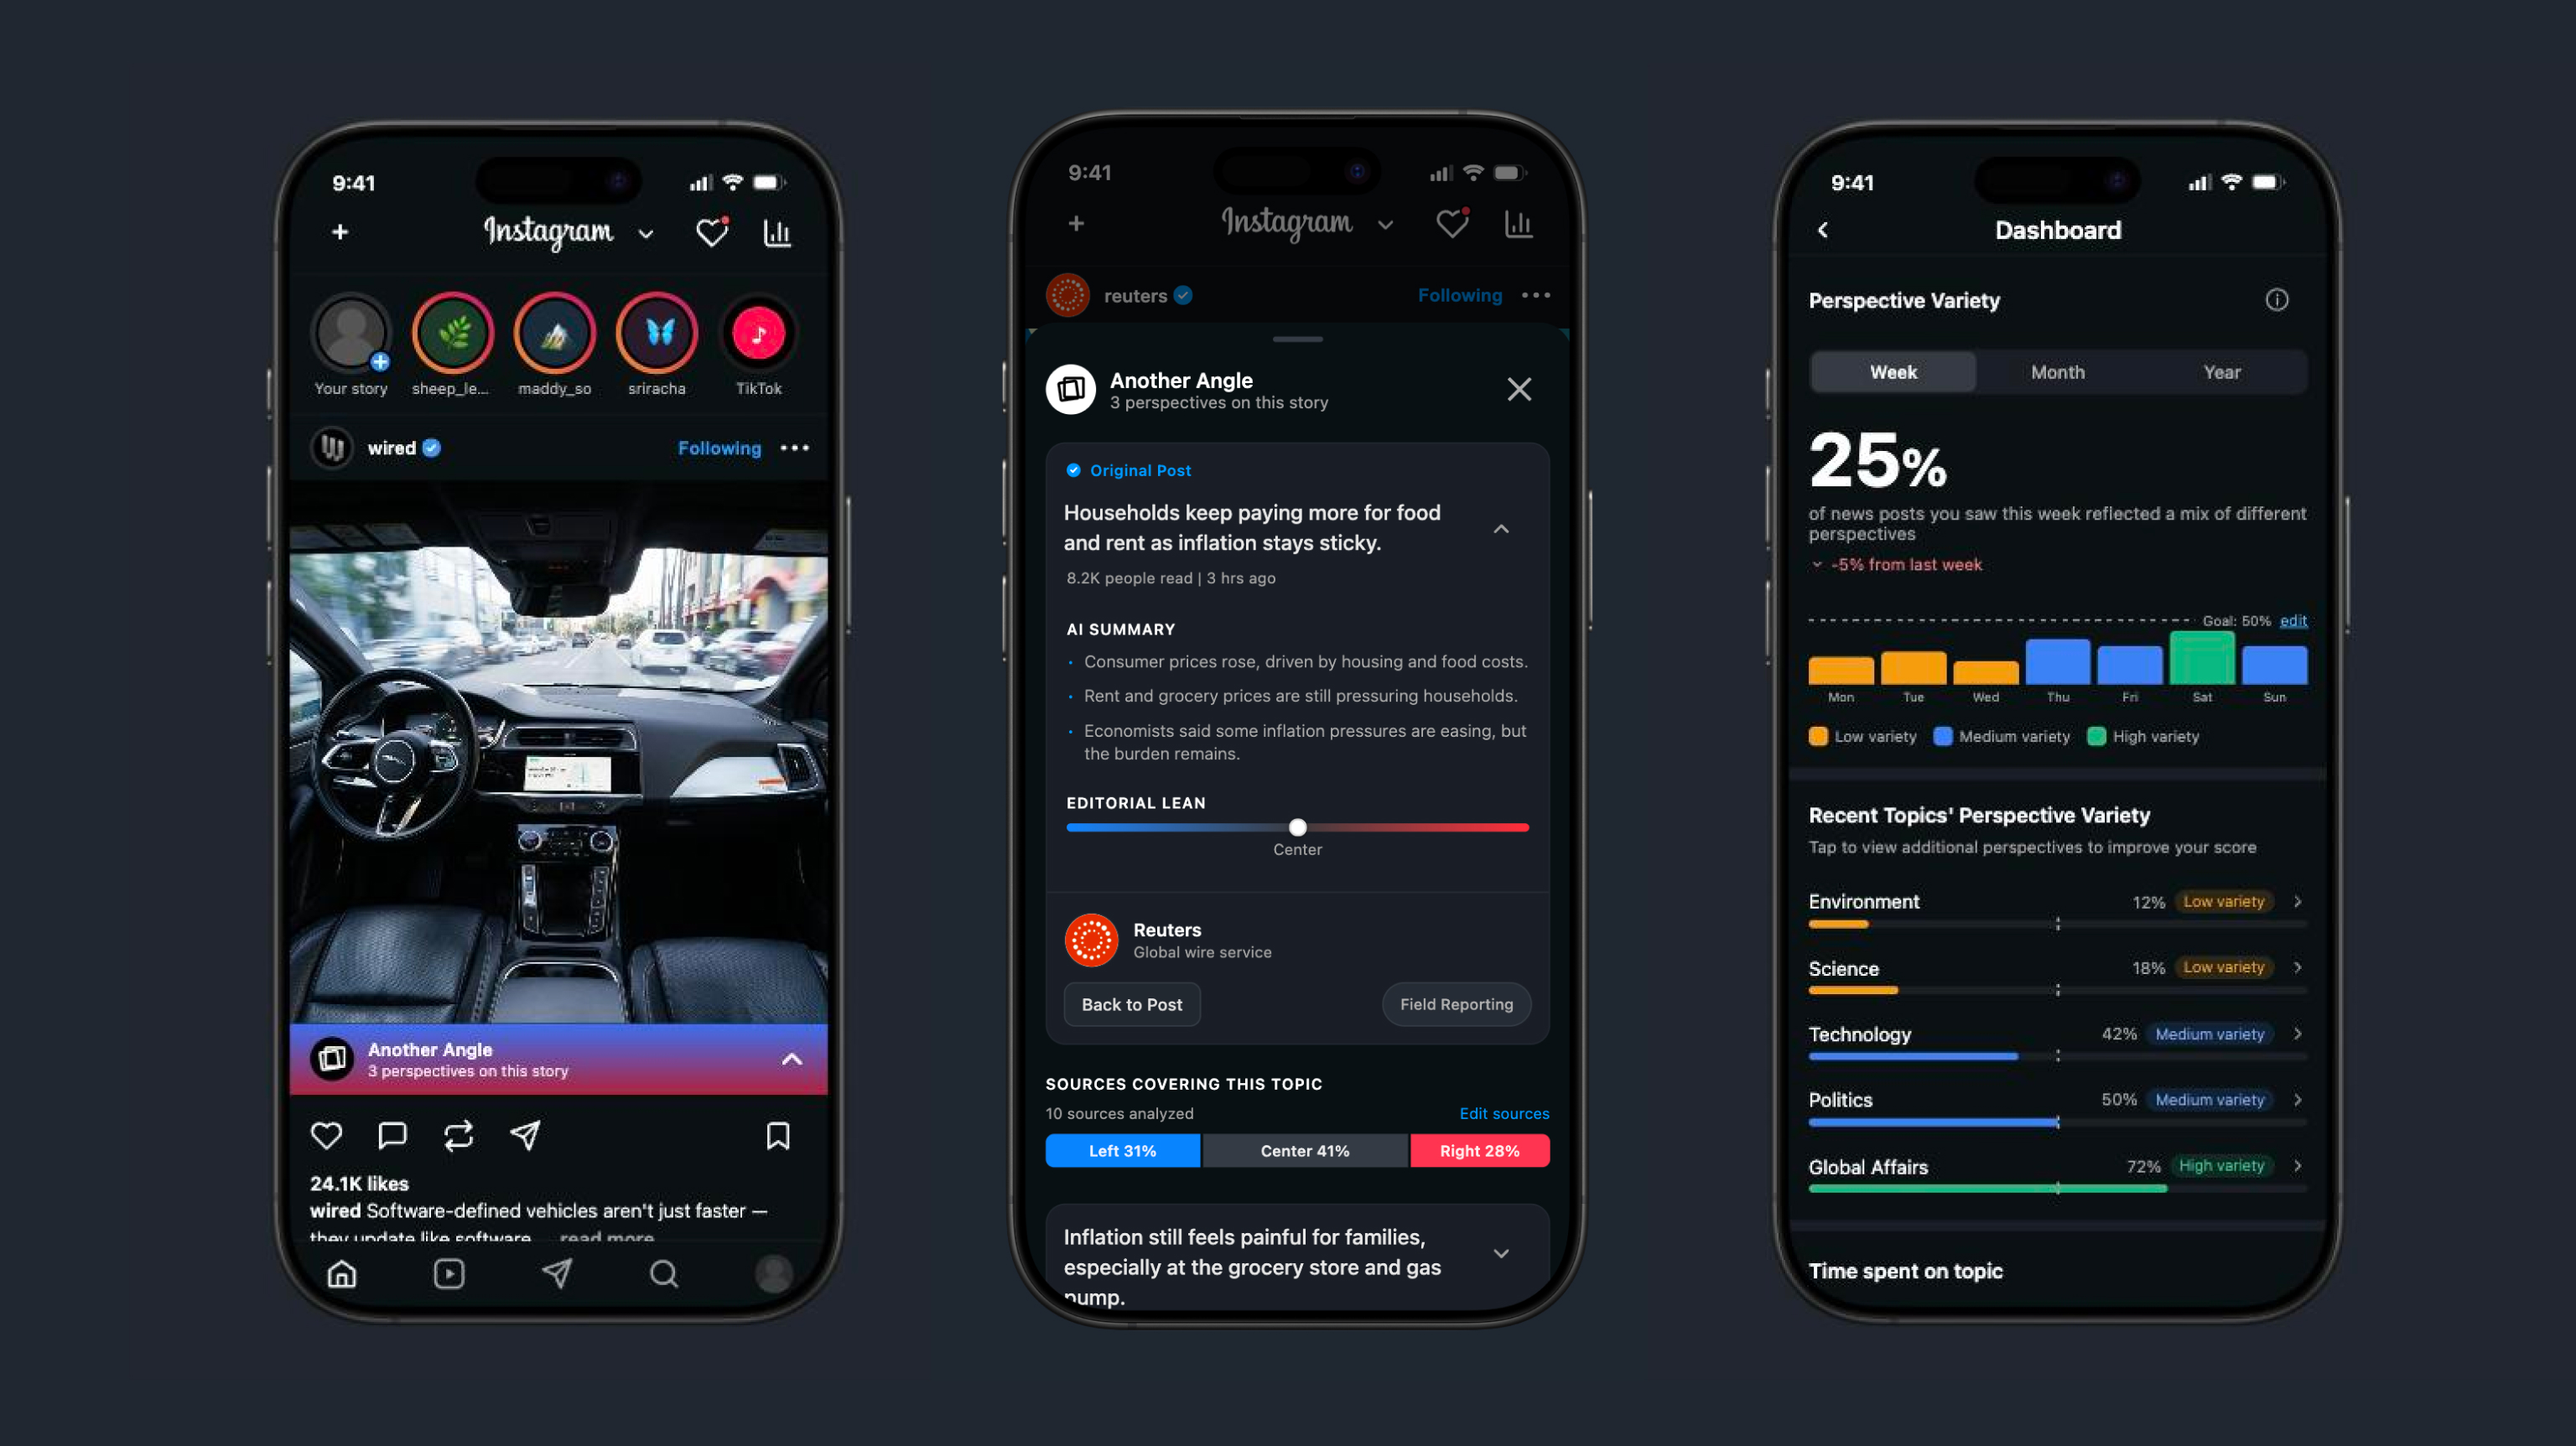
Apr–May 2026

For the final round, I built a high-fidelity, near-production Instagram clone to test the resolved design system, three-perspective cards, progressive disclosure, ranked source preferences, and the reframed dashboard, against 5 more participants.

Hi-fi prototype — perspectives sheet with three source cards

Hi-fi screens: perspective cards, source ranking, dashboard drilldown

What I decided, what the model executed

This phase leaned on AI tools end to end, and I want to be specific about the division of labor:

  • I wrote the feature specifications, the interaction logic, and the visual design language, matching Instagram's actual UI conventions rather than a generic template.
  • The lo-fi prototype was built in Figma Make, an AI prototyping tool, from my sketches.
  • For hi-fi, I prompted Claude Code iteratively to get the build to match Instagram's design language exactly.
  • I then went back into Figma by hand for the pieces the AI output didn't get right, so the final screens combine AI-generated implementation with manually corrected design detail.

Key findings

  • Participants confirmed the three-perspective default, rather than an open-ended list, reduced decision fatigue without feeling restrictive.
  • The progressive-disclosure pattern, neutral framing first with political lean available only if the user opted in, resolved the defensiveness problem seen in both lo-fi and mid-fi, without removing the information entirely.

Perspective diversity as a design problem is real, urgent, and unsolved at scale. The tools that exist today require too much from the people who need them most.

May 2026

Results & Reflection

By exhibition, Another Angle had gone from a hand-drawn concept to a tested, near-production interaction pattern: an in-feed mechanism for surfacing other perspectives, a source-preference system participants trusted, and a media diet dashboard that measured reading variety without accusing anyone of bias.

The exhibition itself was a busy day. CCA's show pulls a crowd, and a steady stream of people stopped at my table, watched the video loop, read the posters, and tried the prototype on the iPad. Most feedback was short and direct: “much needed,” “nice work,” which for a thesis about a problem people already feel but don't act on, felt like the right kind of validation. One of those conversations went further: someone who stopped by got interested enough in the work to offer me a contract job afterward.

Try the live prototype

Reflection

The labeling model needed more segmentation than one flow could give it. Political labels versus neutral framing wasn't a solved binary; it was closer to a spectrum of user types, and I designed for the average of that spectrum rather than for distinct segments. A stronger version of this system would branch the labeling approach by reader type instead of applying one layered-disclosure pattern to everyone, which is what Dr. Lange's archetype suggestion in the expert interview was pointing at.

The variety score is a proxy for a behavior I never directly measured. It tracks what someone was shown and opened, not whether reading a different perspective actually changed how they thought about a story. If I extended this project, the next research question is whether variety score movement correlates with any measurable shift in stated opinion or confidence, not just exposure.